
Analytics & Testing
How to Build a Klaviyo Dashboard That Helps an Ecommerce Brand
Quick answer: A Klaviyo dashboard is a live, account-wide view you build under Analytics > Dashboards. Use it for a snapshot of email, SMS, flows and deliverability: up to 10 cards, with a date range of up to 12 months. Use custom reports when you need to slice campaigns, flows or products, or look back as far as 2 years. We do not install a standard set of dashboard cards on every account. We build a monthly report from Klaviyo and Shopify data. This page is how to create a useful view inside Klaviyo itself.
If you want the monthly KPI scorecard and the targets we use, that lives in our guide to email marketing KPIs. This article is the product side: which Klaviyo reporting tool to use, how to set it up, and how we would organize the view.
By Emiel Dingemans, Founder of Magicianly
Updated
What Is a Klaviyo Dashboard?
A Klaviyo dashboard (Klaviyo also calls these overview dashboards) is a customizable report that sits under Analytics > Dashboards. Klaviyo's Help Center describes it as a place to visualize email, SMS, flow and deliverability trends in one view.
Every account gets a pre-built Overview dashboard. You can customize that one, or click Create Dashboard and start from a blank one. You can keep adding dashboards until the combined total of customizable dashboards and pre-built dashboards marked View only reaches 12.
A dashboard is shared across the account. If you change the date range, the conversion metric, the comparison period or the cards, everyone else who can open it sees those changes too. That is useful once the view is agreed. It is annoying if five people keep editing the same board.
When Should You Use a Dashboard, and When a Custom Report?
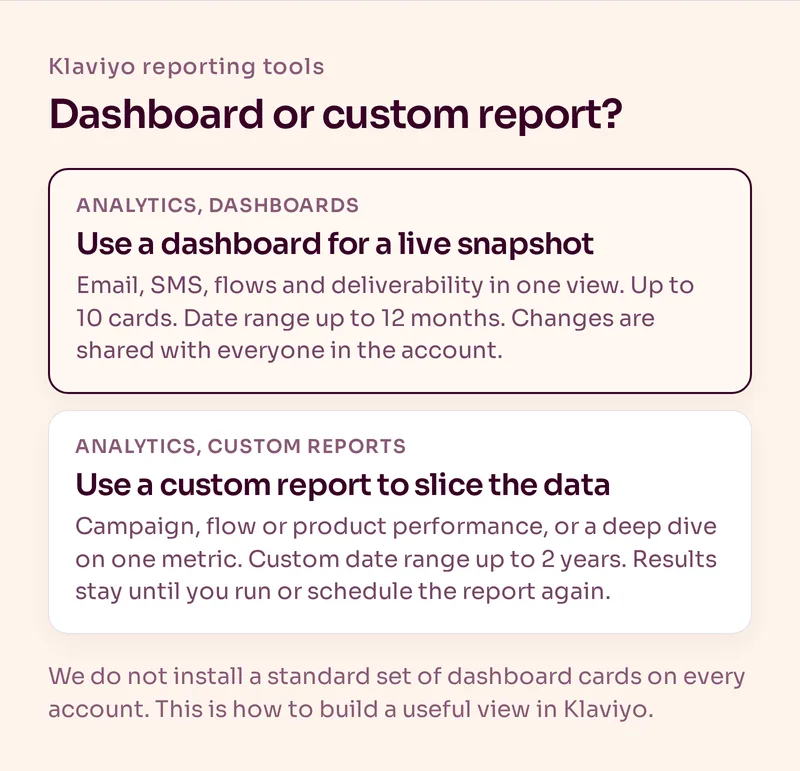
Use a dashboard when you want a live snapshot you can open in the morning and understand quickly. Use a custom report when you need to group, filter or export a deeper cut, or when the question spans more than 12 months.
| Job | Use this | Why |
|---|---|---|
| A live snapshot of email, SMS, flows and deliverability | Dashboard | Up to 10 cards, date range up to 12 months, always visible in the account |
| Campaign performance across the messages you care about | Custom report, campaign performance | Built for that cut, and you can export a CSV |
| Flow performance, overall or in more detail | Custom report, flows performance | Same idea, for flows |
| Product funnel: browse, checkout, purchase | Custom report, product performance | Available when the account has supported product events such as Viewed Product, Checkout Started or Ordered Product |
| One metric, grouped or filtered (for example Placed Order by collection) | Custom report, single metric deep dive | Good for trends. Calculated rates such as open rate are not available in this report type |
| Several metrics in one table | Custom report, multi-metric | Same limit on calculated rates as the single metric report |
Custom reports live under Analytics > Custom reports. You can start from scratch or from the reports library. For a custom date range, the maximum window is 2 years. Timestamps in the report, including exports, use the account's local timezone.
Two limits that catch people out:
- A custom report only includes events filtered by a profile property from the moment that property existed. If you apply a property retroactively, older events still will not show up in the report. Segments do not work that way.
- Unless you schedule the report, it does not refresh on its own, even if you chose a relative range such as the last 30 days. You have to run it again, or set a weekly or monthly schedule so Klaviyo emails you when the new results are ready.
How Do You Create a Klaviyo Dashboard?
The setup is short. The decisions are what you put on it.
- Go to Analytics > Dashboards.
- Open the pre-built Overview dashboard, or click Create Dashboard, name it and start blank.
- Set the time period. The default is the last 30 days. You can choose week-to-date, month-to-date, year-to-date, last 7, 30 or 90 days, last month, last 3 or 12 months, last year, or a custom range of up to 12 months. Dates are inclusive, and the view uses the account's local timezone.
- Set the conversion metric. This can be any account-wide conversion-related event, including events from your integration.
- Optionally set a comparison period: previous period, previous year, or a custom range of up to 12 months. The comparison cannot be an exact copy of the main range.
- Add cards, up to 10 per dashboard. You can pick pre-built cards from the library, or create a card from scratch.
A custom card needs a metric (for example Checkout Started), a measurement (Average, Counts, Unique Counts or Value), and a visualization (table, line graph, bar graph or number). Counts includes repeat events by the same person. Unique Counts counts each profile once. If you group the card and do not add filters, a line or bar graph shows only the top 5 values. Choose a table if you want the full group. You can add up to 5 filter values for a grouping. The number visualization is available only when there is no grouping, or when you selected exactly one filter value.
You can drag cards to reorder them, remove a card from its three-dot menu, and export the whole dashboard with Print to PDF. The PDF uses the card filters saved in your browser, and tables only show the first page of data. To refresh the numbers, use Refresh Data in the dashboard menu. The "Last updated" label tells you when the data was last pulled.
If a dashboard is marked View only, you cannot rename, delete or customize its cards. Your user role decides whether you can create, edit, delete or export dashboards at all.
For the official walkthrough, see Klaviyo's Help Center guide to building an analytics or overview dashboard. The report types above are documented in getting started with custom reports.
How Would We Organize a Useful Ecommerce View?
We do not have a standard pack of Klaviyo dashboard cards that we roll out on every account. The monthly report we send clients is built from Klaviyo and Shopify data, and the exact cards depend on the brand. The organizing idea is stable: look at email and SMS first, then go deeper on retention.
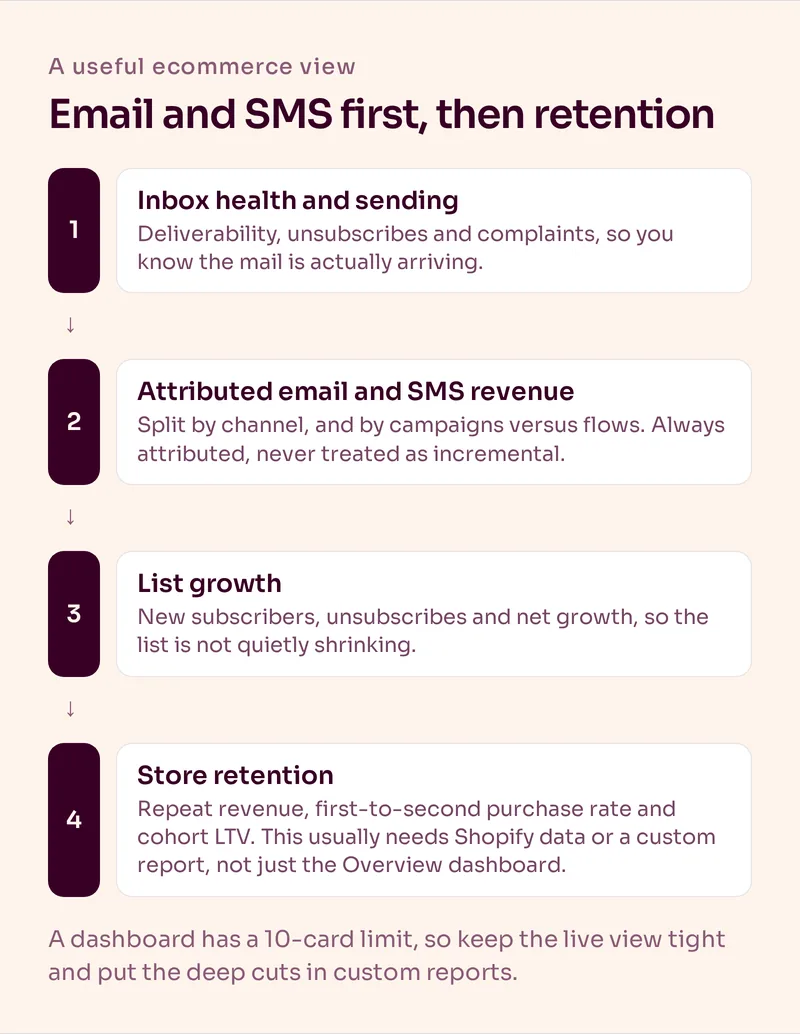
1. Inbox health. If deliveries, bounces, unsubscribes or spam complaints have moved, stop there first. A revenue drop is often an inbox problem in disguise.
2. Attributed email and SMS revenue. Total attributed revenue and its share of store revenue, split by channel and by campaigns versus flows. Always call it attributed. It is not incremental. For why that distinction matters, see Klaviyo attribution.
3. List growth. New subscribers, unsubscribes and net growth, so you can see whether the list is actually growing.
4. Store retention. Repeat revenue, returning customer rate, first-to-second purchase rate and cohort LTV. Some of this you will get from Shopify or a custom report, not from the Overview dashboard alone.
Because a dashboard only holds 10 cards, keep the live view tight. Put the deep cuts (a single flow's conversion, revenue by collection, a cohort window) in custom reports, and link those reports in your monthly review. For the targets we use when we read those numbers, go back to email marketing KPIs. The store-level retention metrics are also covered in ecommerce retention metrics.
If email traffic in Google Analytics looks off, the usual cause is UTM setup, not the dashboard. That is a separate job, and we documented it in email UTM tracking.
What Mistakes Do We See in Klaviyo Reporting?
The most common one is treating attributed revenue as proof that email "made" the sale. It did not, or at least you do not know that from the dashboard. Attributed revenue is useful. It is not incrementality.
The second is stuffing the Overview dashboard until you hit the 10-card ceiling, then never opening a custom report. The dashboard becomes a pile of charts nobody trusts, and the questions that actually change the program (which flows are converting, which campaigns earned their send, whether first-to-second purchase is moving) never get a clean answer.
The third is leaving a relative-range custom report sitting for months and reading last month's run as if it were fresh. If it is not scheduled, run it again.
The fourth is comparing a messy 12-month dashboard against a 30-day view and calling it a trend. Pick one range, use the comparison period, and keep the same conversion metric when you look week to week.
Our Verdict
Build one Klaviyo dashboard you will actually open, with a short set of cards in a fixed order: inbox health, attributed revenue, list growth. Use custom reports for the deeper cuts, and use Shopify data for the retention numbers a dashboard will not give you cleanly. Then read the whole thing next to the KPI targets, not as a substitute for them.
If you also need to decide whether Klaviyo is the right platform in the first place, start with Klaviyo vs HubSpot or our Klaviyo pricing guide.
Frequently Asked Questions
What is a Klaviyo dashboard?
A Klaviyo dashboard is a customizable, account-wide view under Analytics > Dashboards. You can use the pre-built Overview dashboard or create your own, with up to 10 cards, to watch email, SMS, flow and deliverability trends.
How many cards can a Klaviyo dashboard have?
Ten. If you need another card and you are at the limit, remove one or create a second dashboard. An account can have up to 12 dashboards in total, counting customizable dashboards and pre-built ones marked View only.
How do I create a custom report in Klaviyo?
Go to Analytics > Custom reports, then create one from scratch or from the reports library. Choose a report type (single metric deep dive, multi-metric, campaign performance, flows performance, or product performance), set the metrics, timeframe, filters and groupings, and click Save and Run Report.
Can I see open rate in a Klaviyo custom report?
Not in the single metric deep dive or multi-metric report types. Klaviyo's Help Center says calculated rates such as open rate are not available there. Use a campaign performance report, a flows performance report, or the dashboard when you need those rates.
How far back can Klaviyo reporting go?
A dashboard date range can cover up to 12 months. A custom report can use a custom date range of up to 2 years. If you try to run a custom report with a longer window, Klaviyo shows an error.
Should I use a Klaviyo dashboard to judge email ROI?
Use it as one input, not as the verdict. Attributed revenue on a dashboard is still attributed revenue. Pair it with store retention metrics, and do not treat the Klaviyo number as incremental lift.
Want Us to Build and Manage This for You?
Related Reading
Analytics & Testing
Email Marketing KPIs: What We Track Every Month and the Targets We UseOpen rate 45% or higher, click rate 0.5% or higher and the retention numbers that matter more. The email KPIs we report on every month and how we read them.
Read NowAnalytics & Testing
Klaviyo Attribution: Can You Trust the Revenue Number?Klaviyo can accurately apply its attribution rules without proving that an email caused the purchase. Here's how attribution works and what we measure alongside it.
Read NowAnalytics & Testing
Ecommerce Retention Metrics: The 7 Numbers That Actually MatterOpen rate and attributed revenue describe an email program. These seven email marketing metrics describe whether the business is getting stronger.
Read NowRetention Strategy
Klaviyo vs HubSpot: Which Is Better for Ecommerce in 2026?For an ecommerce brand we recommend Klaviyo. HubSpot is the better fit when revenue starts with a sales conversation.
Read Now