
Analytics & Testing
Email Marketing KPIs: What We Track Every Month and the Targets We Use
Quick answer: The email marketing KPIs that matter for an ecommerce brand fall into four groups: inbox health (open rate, click rate, unsubscribe rate, bounce rate and spam complaint rate), revenue (revenue per recipient, placed order rate and attributed revenue), list growth (net new subscribers and signup form submit rate) and retention (first-to-second purchase rate, repeat revenue and LTV by cohort). Our working targets: an open rate of 45% or higher, a click rate of 0.5% or higher, unsubscribes at 0.3% or lower, bounces around 1% or lower and spam complaints at 0.01% or lower.
Most email reports are a page of numbers nobody acts on.
Open rate up, click rate down, revenue "attributed". Same again next month.
More metrics won't fix that. What helps is knowing which question each number answers and having a target for it, so you know when to act. This is the set we use in the monthly reports we send our clients.
By Emiel Dingemans, Founder of Magicianly
Updated
What's the Difference Between an Email KPI and an Email Metric?
A metric is any number your email platform shows you. A KPI is a metric you've picked because it tells you whether the program is working, with a target attached. Klaviyo gives you dozens of metrics. You need about a dozen KPIs.
At the business level, open rate and click rate are diagnostics, not goals. We make that point in our guide to ecommerce KPIs. Inside the email program they still deserve a target, because they're the first warning that something's off.
Which Email Marketing KPIs Should You Track?
These, grouped by the question each one answers. The targets are Magicianly's own working targets, not industry benchmarks. Where we don't use a fixed target, we compare with last month.
| Group | KPI | The question it answers | Our target |
|---|---|---|---|
| Inbox health | Open rate | Are emails reaching people who want them? | 45% or higher (50% or higher on a 90-day engaged segment) |
| Inbox health | Click rate | Did the email get people to the site? | 0.5% or higher per send |
| Inbox health | Unsubscribe rate | Are we sending too much, or to the wrong people? | 0.3% or lower |
| Inbox health | Bounce rate | Is the list clean? | Around 1% or lower |
| Inbox health | Spam complaint rate | Are people annoyed enough to complain? | 0.01% or lower |
| Revenue | Revenue per recipient | What does each send earn per person? | Compare with last month |
| Revenue | Placed order rate | How often does a send turn into an order? | Compare with last month |
| Revenue | Attributed revenue and its share of store revenue | How much revenue does email touch? | Read the trend, never a fixed percentage |
| List growth | Net subscriber growth | Is the list growing after unsubscribes? | Compare with last month, per channel |
| List growth | Signup form submit rate | Are your forms capturing visitors? | Compare per form with last month |
| Retention | First-to-second purchase rate | Do first-time buyers come back? | Compare by cohort |
| Retention | Repeat revenue share | How much revenue comes from returning customers? | Compare with last month |
| Retention | LTV per new customer by cohort | Are newer customers worth more? | Each cohort beats the one before |
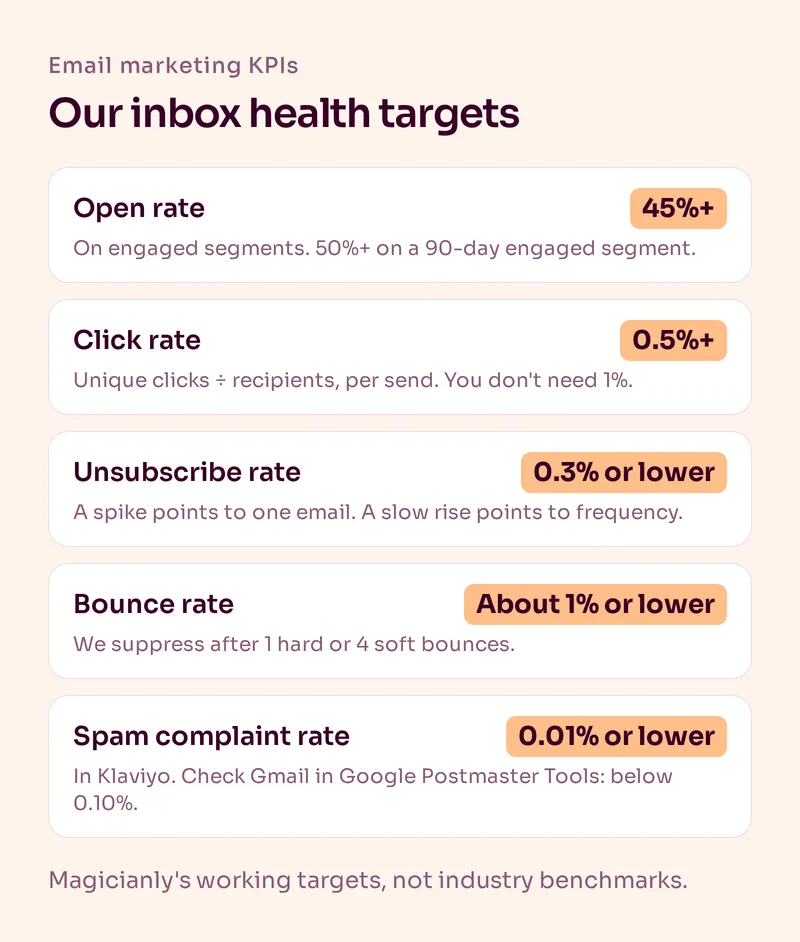
Which KPIs Show Whether Your Emails Reach the Inbox?
Open rate, click rate, unsubscribe rate, bounce rate and spam complaint rate. Together they tell you whether inbox providers and subscribers still want your email. When these slip, everything below them slips too.
- Open rate: 45% or higher. Measure it on campaigns sent to engaged segments, not on the whole list, because unengaged contacts drag the average down. On a 90-day engaged segment we want 50% or more, and that already leaves room for Apple Mail Privacy Protection inflating opens. If a 90-day segment stays under 50%, we send campaigns to a 60-day or 30-day engaged segment for a while. Here's how we raise email open rates.
- Click rate: 0.5% or higher per send. Unique clicks divided by recipients. You don't need 1%, which usually means sending to tiny segments. Our guide to email click rate explains why.
- Unsubscribe rate: 0.3% or lower. One spike usually points to one email or one segment. A slow rise points to frequency or the quality of new subscribers.
- Bounce rate: around 1% or lower. Above that, clean the list. We suppress a profile after 1 hard bounce or 4 soft bounces.
- Spam complaint rate: 0.01% or lower. That's the rate Klaviyo shows. Gmail doesn't pass its spam complaints on to Klaviyo, so also check Google Postmaster Tools, where Google's guidance is to stay below 0.10% and never reach 0.30%.
Which KPIs Show Whether Email Makes Money?
Revenue per recipient and placed order rate. They show what each send earns per person and how often it turns into an order, so you can fairly compare a send to 20,000 people with one to 200,000.
- Revenue per recipient: attributed revenue divided by recipients. Our main number for comparing campaigns and flows.
- Placed order rate: orders divided by recipients. In Klaviyo it's called placed order rate, and it's the conversion rate we report.
- Average order value from email: read it next to placed order rate. More orders at a lower order value can mean people are waiting for the next discount.
- Attributed revenue and its share of store revenue: we report it every month, split by campaigns and flows, and by first-time and repeat customers. We always call it attributed, never incremental, because it's the output of Klaviyo's model.
When we pick the top three campaigns of the month, and the three we learn the most from, we judge them on revenue per recipient and placed order rate, not on total revenue. A send to your whole list almost always wins on total revenue. That doesn't make it your best email.
For flows we look at the same numbers per flow, plus how much repeat revenue each one brings in.
Which KPIs Show Whether Your List Is Growing?
Net subscriber growth and signup form submit rate. New subscribers minus unsubscribes, per channel, shows whether email and SMS are growing or shrinking. Submit rate per form shows where that growth comes from.
Look at the signup source as well. If one popup brings in nearly all your subscribers, that's the form to test first. For popups, around 8 to 12% of visitors is strong in our experience, and most accounts we open start around 2 to 3%.
Which KPIs Show Whether Email Builds Retention?
First-to-second purchase rate, repeat revenue share and LTV per new customer by cohort. These tell you whether email is building the business or just collecting credit for orders that would have happened anyway.
- First-to-second purchase rate at 30, 60, 90, 180 and 365 days after the first order.
- Repeat revenue, its share of store revenue and how much of it email and SMS touched.
- LTV per new customer by monthly cohort. Only compare cohorts whose window is complete. A January cohort's 90-day LTV isn't final until May.
We'd rather see a brand with 35% of revenue attributed to email and a 90-day LTV that grows month after month than one at 60% with a flat repeat purchase rate. The attribution share is a surface number. The cohort data tells you what's really happening. We go through these metrics with formulas in our guide to ecommerce retention metrics.
How Do You Use These KPIs to Find a Problem?
Work from the top down. If email revenue drops, check inbox health first, then opens, then clicks, then orders. The first KPI that's off target is usually where the problem starts.
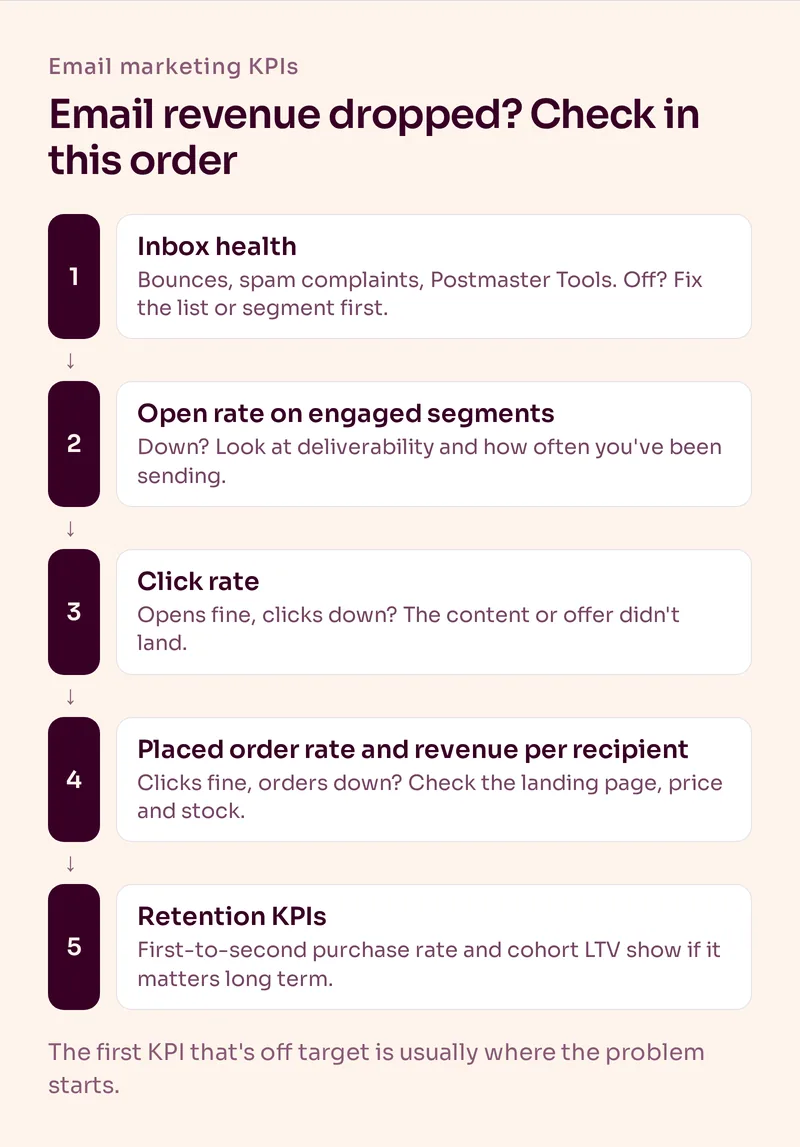
A few patterns we see a lot:
- Bounces or spam complaints jump: a list source or segment problem. Fix that before you touch copy.
- Opens drop on an engaged segment: deliverability or a frequency problem, especially after a heavy sending period.
- Opens hold, clicks drop: the content or the offer didn't land.
- Clicks hold, orders drop: look at the landing page, price, stock or offer, not the email.
How Often Should You Check Email Marketing KPIs?
Every month for the full set, with cohorts added once their window is complete. Before every send, a quality check rather than a KPI check.
Before every send: a check of segments, exclusions and design, so mistakes never go live.
Every month: the full set compared with last month, the top three campaigns and the three to learn from, and an honest note on what we're testing next.
Cohorts: compared only once their 30, 60, 90, 180 or 365-day window has closed.
Send days: picked on which weekday converts best, not which weekday gets the most opens.
Which Email Metrics Shouldn't Be KPIs?
Numbers that look good and don't tell you what to do next.
- Open rate across your whole list. Unengaged contacts and Apple Mail Privacy Protection make it meaningless. Measure engaged segments.
- List size on its own. A big list nobody opens hurts deliverability.
- Click-to-open rate. In Klaviyo it's called click-through rate. It hides how many people you actually sent to.
- A target share of revenue from email. "Email should be 30% of revenue" sounds like a goal, but a high share can just mean generous attribution or weak acquisition.
Summary
Track email marketing KPIs in four groups: inbox health, revenue, list growth and retention. Our working targets are an open rate of 45% or higher on engaged segments, a click rate of 0.5% or higher, unsubscribes at 0.3% or lower, bounces around 1% or lower and spam complaints at 0.01% or lower. Judge campaigns on revenue per recipient and placed order rate, and judge the whole program on first-to-second purchase rate and cohort LTV.
Want to know where your customers come from in the first place? A how did you hear about us survey asks them. If you'd like us to run your email program against these numbers, see our email marketing service.
Frequently Asked Questions
What are the most important email marketing KPIs?
For ecommerce: open rate on engaged segments, click rate, unsubscribe, bounce and spam complaint rate for inbox health, then revenue per recipient and placed order rate for revenue, and first-to-second purchase rate and cohort LTV for retention.
What is a good email open rate for ecommerce?
We aim for 45% or higher on campaigns sent to engaged segments, and 50% or higher on a 90-day engaged segment. Whole-list open rates are lower and less useful, because unengaged contacts and Apple Mail Privacy Protection distort them.
What is a good click rate for email marketing?
We aim for 0.5% or higher per send, measured as unique clicks divided by recipients. You don't need 1%. Getting there usually means sending to much smaller segments, which can cost you revenue.
What is a good unsubscribe rate?
We aim for 0.3% or lower per send. One spike usually points to one email or segment. A steady rise points to sending frequency or to the quality of the subscribers you're adding.
How do you measure email marketing success?
Look past attributed revenue. Judge campaigns on revenue per recipient and placed order rate, and judge the program on first-to-second purchase rate, repeat revenue and LTV per new customer by cohort, compared month over month.
How often should you review email marketing KPIs?
Monthly for the full set of KPIs, compared with the previous month. Cohort KPIs like 90-day LTV only once the cohort's window has closed. Before every send, check segments, exclusions and design instead.
Want Us to Build and Manage This for You?
Related Reading
Analytics & Testing
Ecommerce Retention Metrics: The 7 Numbers That Actually MatterOpen rate and attributed revenue describe an email program. These seven email marketing metrics describe whether the business is getting stronger.
Read NowAnalytics & Testing
What Is a Good Email Click Rate? Click Rate vs Click-Through Rate in KlaviyoYour click rate is 0.6%. Is that bad? Usually not. Here's what each click metric measures in Klaviyo, what's good, and why chasing 1% can cost you revenue.
Read NowEmail Campaigns
How to Increase Email Open Rates (It's Usually Not Your Subject Lines)You've tested emojis, send times and subject line after subject line, and your open rates barely moved. Here's what actually fixes them, in the order we fix it.
Read NowAnalytics & Testing
How Did You Hear About Us Survey: Questions, Answer Options and SetupYour ad platforms can't see the podcast or the friend who sent a customer your way. Where to ask, which options to use, a template and how to read the answers.
Read Now